Do We Eat a Credit Card of Plastic a Week? What the Studies Show
“A credit card’s worth of plastic every week” is one of the most repeated microplastics statistics. We traced it to the original report and paper, then checked what later studies found.
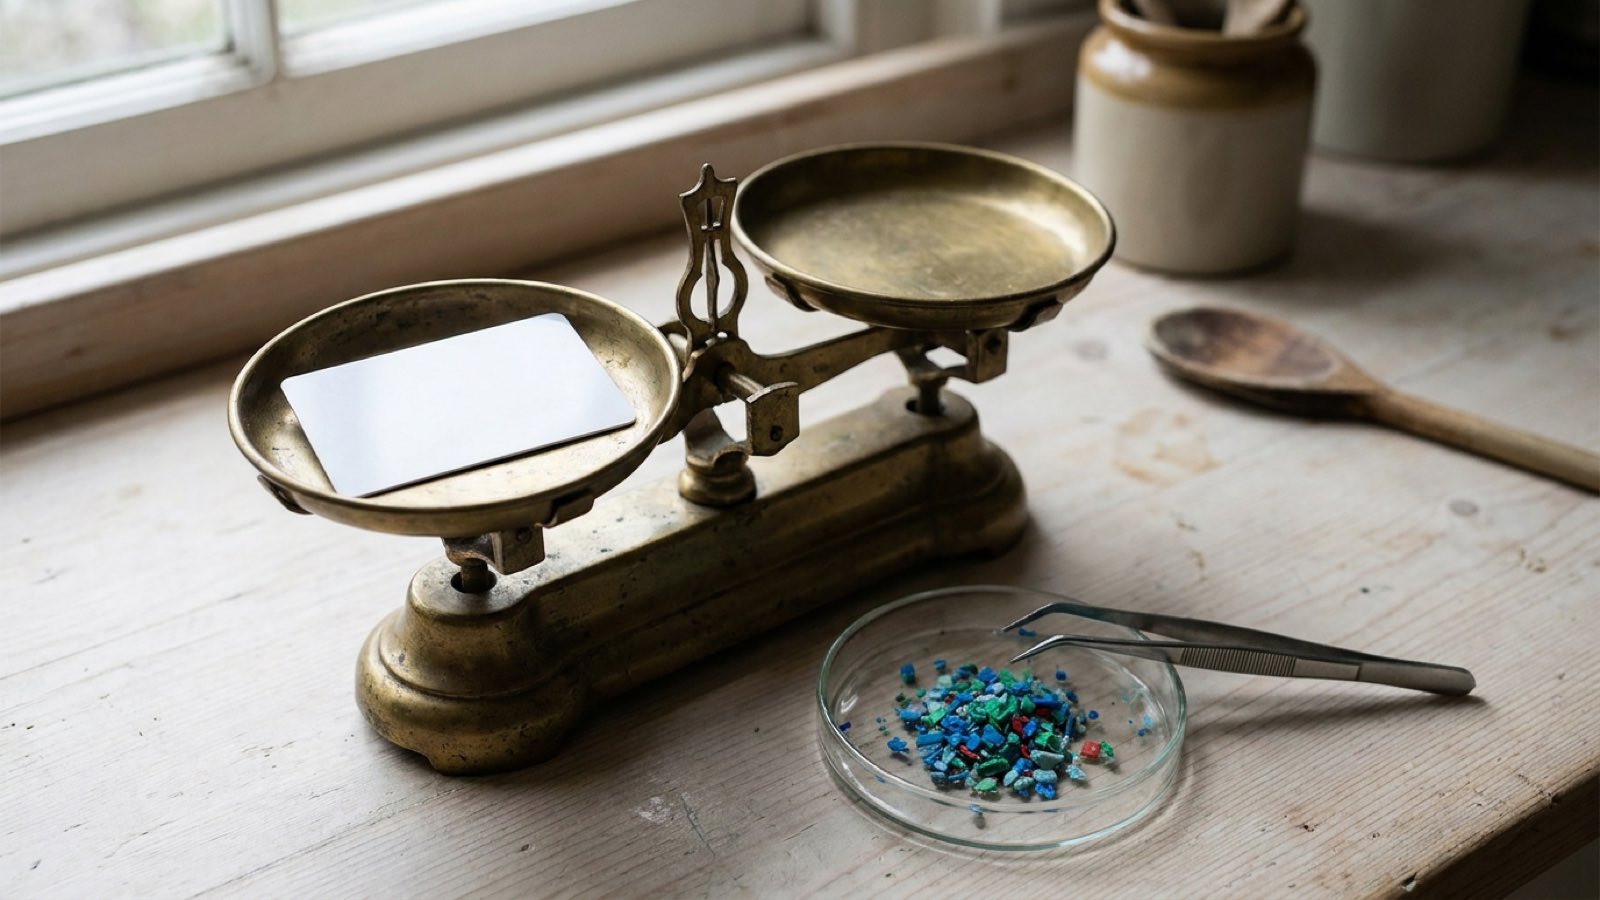
Almost certainly not, for a typical person. The 5-gram “credit card a week” comes from a 2019 WWF-commissioned analysis, and it is the top of a 0.1 to 5 gram range. A later peer-reviewed model put median adult intake at about 4 micrograms a week, roughly a million times less, and an independent re-check concluded that the original calculation overestimated by several orders of magnitude. The exposure itself is real: people swallow and breathe in plastic particles every day, the smallest ones can’t yet be counted reliably, and a smaller number is not proof of safety. See the studies we checked.
This is a research-based fact-check. We traced the claim to the WWF report and the peer-reviewed paper behind it, then read the later estimates and critiques. We have not measured anyone’s plastic intake, and this page recommends no products.
The credit-card claim and later estimates at a glance
| Study | What it estimated | Headline number | Our read |
|---|---|---|---|
| WWF report (2019) | Weekly plastic ingestion for an average person, from a University of Newcastle analysis | About 5 g a week, “a credit card” | Published before the peer-reviewed paper |
| Senathirajah et al. (2021) | Peer-reviewed version of that analysis, from 59 publications | 0.1 to 5 g a week | The credit card is the top of the range |
| Cox et al. (2019) | Particle counts in the American diet, covering about 15% of calories | 39,000 to 52,000 particles a year | Counts only; authors say likely underestimates |
| Mohamed Nor et al. (2021) | Probabilistic model of 8 foods and drinks plus air, 1–5,000 µm | Adult median 883 particles and 583 ng a day | Puts the WWF figure above its 99th percentile |
| Pletz (2022) | Independent re-check of the Senathirajah calculation | Overestimate by several orders of magnitude | The most direct critique |
| Zhao and You (2024) | Model of 109 countries, 1990 to 2018 | Highest: Indonesia, 15 g a month | Gram-scale again; assumes average-size spheres |
| Heo et al. (2024) | Systematic review of 76 food and water studies | 0.0002 to 1,531,524 particles a day | Shows how far apart the counts are |
| Hayder et al. (2026) | Review of 193 count-based and 12 mass-based food papers | Median 721 particles per kg of body weight a day | The lab method changes results |
Each number is given in the units its study used. None of these studies measured a health outcome.
Where “a credit card a week” came from
In June 2019, WWF published No Plastic in Nature: Assessing Plastic Ingestion from Nature to People, written for WWF by the consultancy Dalberg Advisors. It summarized a then-new University of Newcastle (Australia) study and said an average person “could be ingesting approximately 5 grams of plastic every week,” the equivalent of a credit card.
The report’s chart lists particles of 0 to 1 mm swallowed per week: 1,769 from drinking water (tap and bottled), 182 from shellfish, 10 from beer and 11 from salt. It said shellfish alone could account for as much as 0.5 grams a week. Its methodology section was candid: the analysis built on a limited set of evidence, key data such as the weight and size distribution of microplastics were lacking, and every assumption and extrapolation added uncertainty.
The underlying analysis reached a peer-reviewed journal more than a year later, as Senathirajah et al. in the Journal of Hazardous Materials (volume 404, article 124004; online October 2020). Drawing on 59 publications, the authors calculated an average mass for individual microplastics in the 0 to 1 mm range and estimated that, globally on average, people may ingest 0.1 to 5 grams of microplastics a week (per the PubMed abstract). The credit card is the top of that range; the bottom is 50 times smaller. One of the six authors is affiliated with WWF.
A quick check using the report’s own numbers
The four sources in WWF’s chart add up to about 1,970 particles a week. For that many particles to weigh 5 grams, each would need to average about 2.5 milligrams. A solid polyethylene sphere 1 mm across, the top of the chart’s size range, weighs about half a milligram. Even a 1 mm cube of PVC, one of the denser common plastics, weighs about 1.4 milligrams.
This is our arithmetic, not a reconstruction of the paper: we could not access its full text, and its exact method for assigning masses may differ from a simple average. But it points to the same weak spot the independent re-check identified below: the mass assigned to each particle.
What later studies found
Mohamed Nor et al. (2021): micrograms, not grams
In 2021, a Wageningen University team (Nur Hazimah Mohamed Nor, Merel Kooi, Noël Diepens and Albert Koelmans) published a probabilistic lifetime exposure model in Environmental Science & Technology. It combined published measurements for eight foods and drinks (fish, mollusks, crustaceans, tap water, bottled water, salt, beer and milk) plus inhaled air, for particles from 1 to 5,000 µm. Instead of assigning one average mass per particle, it used distributions of particle size, shape and density.
The median adult intake came out at 883 particles a day, weighing 583 nanograms in total; for children it was 553 particles and 184 nanograms. That is about 4.1 micrograms a week for adults, the figure later critiques cite. The authors noted that earlier risk assessments had assumed 0.007 to 4 µg per particle, values above the 85th percentile of their own mass distributions. WWF’s figure, they wrote, sat above the 99th percentile of their distribution and “does not represent the intake of an average person.”
At the model’s median rate, swallowing 5 grams would take roughly 23,000 years (our arithmetic). Even if real intake were 1,000 times higher than that median, it would be about 4 milligrams a week, still more than 1,000 times short of a credit card.
The model has blind spots, and they could push the true number up. It left out particles smaller than 1 µm, and it covered only eight foods; the authors flag the unknown contribution of other foods as a research need. A 2026 review, described below, found that fruit, vegetables and grains yielded the highest estimated intake of the food groups it covered.
Pletz (2022): “Do humans eat one credit card per week?”
Martin Pletz of Montanuniversität Leoben in Austria re-checked the Senathirajah calculation in the open-access Journal of Hazardous Materials Letters (a companion title to the main journal). His abstract says the analysis paired average particle masses from studies that reported particle sizes with particle counts from other studies of shellfish, salt, beer and water. He identifies serious problems with how the data were combined and how particle sizes were obtained, concludes that it overestimates ingested mass by several orders of magnitude, and argues that ingested mass is a minor factor in how microplastics might cause harm.
Why that pairing matters, in plain terms: studies with finer detection count many more small particles, while an average mass is dominated by the big ones. Multiplying a count weighted toward small particles by a mass weighted toward large ones inflates the total.
Cox et al. (2019): counting particles, not grams
A 2019 analysis in Environmental Science & Technology used 402 data points from 26 studies to estimate how many particles Americans swallow. From foods covering about 15% of calories, it estimated 39,000 to 52,000 particles a year depending on age and sex, or 74,000 to 121,000 including inhalation. People who meet their water needs only from bottled water may take in an additional 90,000 particles a year, compared with 4,000 for tap-only drinkers. The authors said their estimates are likely underestimates. The study reported counts, not mass.
Zhao and You (2024): gram-scale estimates haven’t disappeared
A 2024 Cornell University model in Environmental Science & Technology estimated dietary and airborne microplastic uptake in 109 countries from 1990 to 2018 and put Indonesia at the top, at 15 grams a month per person. It converted particle counts to mass by assuming spherical particles of average size and density, the kind of single-value shortcut the Wageningen team argued overstates mass. A later correction fixed units in its supplementary information.
Reviews: the counts span about ten orders of magnitude
A 2024 systematic review in Reviews on Environmental Health (Heo, Moon and Kim) covered 76 studies published through 2023. Estimated daily intake from food ranged from 0.0002 to 1,531,524 particles a day, with the highest value from bottled water. The authors scored average study quality at 11.5 of 20 points for food studies and 11.16 of 19 for drinking water.
A 2026 review in the Journal of Hazardous Materials (Hayder, Laan and van Wezel) gathered 193 papers that counted particles in food and only 12 that measured mass. It estimated a median of 721 particles per kilogram of body weight per day, found that fruit, vegetables and grains yielded the highest estimated intake, and found that the analytical technique used had a pronounced effect on results for some foods, including tap and bottled water.
Why particle counts and mass tell different stories
The Wageningen model counted more particles than WWF’s chart (883 a day, or over 6,000 a week, against about 1,970 a week) and still found about a millionth of the mass. That is not a contradiction. A particle’s mass rises with the cube of its width: make it 10 times wider and it weighs 1,000 times more.
| Particle width | Mass of one polyethylene sphere (approx.) | Number needed to weigh 5 g (approx.) |
|---|---|---|
| 1 mm | 0.5 milligram | 10,000 |
| 100 µm | 0.5 microgram | 10 million |
| 10 µm | 0.5 nanogram | 10 billion |
| 1 µm | 0.5 picogram | 10 trillion |
| 100 nm (a nanoplastic) | 0.5 femtogram | 10 quadrillion |
Our arithmetic, for solid spheres at a density of 0.95 g/cm³. Real particles are often fibers or flakes, and common plastics range from about 0.9 to 1.4 g/cm³.
So a count can be large while the mass is tiny, and a mass estimate can swing by orders of magnitude depending on the size you assume for a typical particle. That is the core of the credit-card problem: the particle counts came from measurements, but the grams came from assumptions about size.
Why every mass estimate is uncertain
- Size cut-offs. Studies count only what their filters and instruments can detect. The bottled- and tap-water studies the WWF report cited counted particles larger than 100 µm. Lower the cut-off and the count rises sharply, while the added mass is usually small, because small particles weigh so little.
- Shape and density. Turning a count into a mass means assuming each particle’s size, shape and density. A thin fiber weighs far less than a sphere of the same length. Mohamed Nor et al. used distributions; Zhao and You assumed spheres of average size.
- Nanoplastics are mostly missing. Using a newer imaging method, Qian et al. (2024) estimated about 240,000 particles per liter in the bottled water they tested, about 90% of them nanoplastics, orders of magnitude more than earlier microplastic counts in bottled water. The FDA says there are no standardized methods for measuring micro- and nanoplastics in food, and that available methods are not very reliable for nanoplastics. Each nanoplastic weighs almost nothing, so they may add huge numbers but little mass; no one can yet say how much.
- Few direct mass measurements. Most data are counts: 193 count-based food papers against 12 mass-based ones in the 2026 review. Methods that weigh plastic directly have their own problems. Rauert et al. (2025) concluded that pyrolysis–GC/MS is not currently suitable for measuring polyethylene and PVC in biological samples, partly because fats produce fragments that resemble polyethylene.
- Contamination and false positives. Plastic is everywhere in labs. Clough et al. (2026) found that nitrile and latex gloves can leave residues whose spectra resemble microplastics, producing false positives in standard analyses.
- Diet coverage. Cox et al. covered about 15% of calories, and Mohamed Nor et al. eight foods and drinks. The 2026 review found seafood overrepresented in the research, while fruit, vegetables and grains yielded the highest estimated intake.
What this does and doesn’t mean for your health
Debunking the credit card does not make microplastics harmless. On current evidence:
- Mass is not the only thing that matters. Smaller particles are thought to enter the body more readily. Mohamed Nor et al. assumed that only particles under 10 µm are absorbed, a cut-off they called to some extent arbitrary, and Qian et al. note that nanoplastics are believed to be more toxic because of their size. A tiny mass of tiny particles is not automatically a tiny risk.
- Plastic chemicals: the Wageningen model found that microplastics contribute a small share of total intake of the plastic-associated chemicals it modeled, compared with other sources in food.
- Regulators: the FDA says current scientific evidence does not demonstrate that levels of micro- or nanoplastics detected in foods pose a risk to human health, and that more research is needed.
- Plastic in tissue: studies have reported plastic in blood, artery plaque and organs, with methods still being validated. We cover that evidence in our review of whether microplastics can be removed from the body.
- A new mechanism: an October 2026 Nature study found that common microplastics generate reactive hydroxyl radicals at their surface in water. That is a possible mechanism for harm, tested in the lab, not evidence of harm in people. See our breakdown of the Nature study.
Our read: the best-documented model puts typical adult intake in micrograms a week. Gram-scale estimates rest on mass conversions that independent researchers have challenged, and no one can yet put a reliable number on nanoplastics. No study has shown what any of these amounts does to human health.
“A spoon of plastic in the brain”: the same pattern
In February 2025, Nihart et al. in Nature Medicine reported plastic, mostly polyethylene, in autopsy samples of brain, liver and kidney from New Mexico, with higher brain concentrations in 2024 than in 2016. Study author Matthew Campen of the University of New Mexico told CNN that the concentration in normal brain tissue, about 4,800 micrograms per gram, was the equivalent of an entire standard plastic spoon. In the same interview, he said current methods could be overstating or understating levels.
A Matters Arising in Nature Medicine (November 2025) argued that the study reported limited contamination controls and lacked validation steps, that tissue digestion was below 90% efficient for several brain samples, and that fats, about 60% of the brain’s dry weight, produce pyrolysis fragments that can mimic polyethylene. The original authors replied, and a March 2025 author correction fixed duplicated images.
Our read: many studies support the finding that plastic reaches human tissue. How much, especially in the brain, is not settled. A spoon, like a credit card, turns a disputed number into a household object, and the object sticks long after the caveats are forgotten.
What actually reduces intake
The amounts are uncertain, but the sources that lab studies flag are consistent, and the swaps are simple. None has been shown to improve health; each cuts a measured source of exposure.
- Filter tap water instead of defaulting to bottled. Cox et al. estimated that bottled-only drinkers may take in an extra 90,000 particles a year, against 4,000 for tap-only drinkers, and in the Wageningen model bottled water had the highest high-end (95th percentile) mass intake of any source. Our water filter guide compares filters with published microplastic data.
- Don’t heat food in plastic. In a 2023 lab study, microwaving some containers released up to 4.22 million microplastic and 2.11 billion nanoplastic particles per square centimeter of plastic within three minutes. Store and reheat in glass containers.
- Keep plastic out of boiling water. Heat drives release in lab studies: polypropylene baby bottles released up to 16.2 million particles per liter during formula preparation, and sterilizing and high-temperature water significantly increased release. A plastic-free kettle removes one routine hot-plastic contact.
- Check your tea bags. In a 2019 lab study, one plastic mesh tea bag steeped at 95 °C released about 11.6 billion microplastics and 3.1 billion nanoplastics into the cup. See which tea bags have plastic.
For why researchers keep studying these particles even at low doses, read our breakdown of the October 2026 Nature study on microplastic surfaces and reactive radicals.
Frequently asked questions
Do we really eat a credit card of plastic a week?
Almost certainly not, for a typical person. The 5-gram figure is the top of a 0.1 to 5 gram range from a 2019 WWF-commissioned analysis. A later peer-reviewed model put median adult intake at about 4 micrograms a week, and an independent re-check concluded that the original calculation overestimated by several orders of magnitude.
Where did the credit card a week claim come from?
From a June 2019 WWF report written by Dalberg Advisors, which summarized an analysis by the University of Newcastle in Australia. That analysis was later published as Senathirajah et al. in the Journal of Hazardous Materials, with a range of 0.1 to 5 grams a week.
How much plastic do we actually eat per week?
No one knows precisely. The best-documented model estimated a median of 883 particles and 583 nanograms a day for adults, about 4.1 micrograms a week. Other studies range from under one particle to more than a million particles a day, and nanoplastics cannot yet be counted reliably.
How long would it take to eat a credit card’s worth of plastic?
At that model’s median adult intake of about 4.1 micrograms a week, reaching 5 grams would take roughly 23,000 years. Even at 1,000 times that rate, it would take more than 20 years.
Why do microplastic intake estimates vary so much?
Most studies count particles, and turning counts into grams means assuming each particle’s size, shape and density. Because mass rises with the cube of a particle’s width, small changes in the assumed size move the total by orders of magnitude. Size cut-offs, contamination and missing nanoplastics add more uncertainty.
Is eating microplastics harmful?
That has not been established. The FDA says current evidence does not show that levels detected in food pose a risk to human health, and research is ongoing. A smaller mass does not mean no risk, because the smallest particles are thought to be the most likely to enter the body.
Sources and editorial method
Reviewed October 27, 2026. This is a research-based fact-check, not a laboratory study or medical guidance. We read the WWF report in full, the open full text of Mohamed Nor et al. and Zhao and You, and the abstracts of the other papers below, and we checked every DOI against Crossref. Where we could reach only a paper’s abstract, including Senathirajah et al. and Pletz, we limited our description to what the abstract states. Calculations marked as ours are illustrative arithmetic, not results from any study. We have not measured microplastics in any food, drink or person.
- WWF (2019): No Plastic in Nature: Assessing Plastic Ingestion from Nature to People. Analysis by Dalberg Advisors, published June 2019.
- Senathirajah et al. (2021): Estimation of the mass of microplastics ingested – a pivotal first step towards human health risk assessment, Journal of Hazardous Materials 404:124004; PubMed abstract.
- Mohamed Nor et al. (2021): Lifetime accumulation of microplastic in children and adults, Environmental Science & Technology 55(8):5084–5096. Open full text.
- Pletz (2022): Ingested microplastics: Do humans eat one credit card per week?, Journal of Hazardous Materials Letters 3:100071.
- Cox et al. (2019): Human consumption of microplastics, Environmental Science & Technology 53(12):7068–7074.
- Zhao and You (2024): Microplastic human dietary uptake from 1990 to 2018 grew across 109 major developing and industrialized countries, Environmental Science & Technology 58(20):8709–8723, and its correction.
- Heo, Moon and Kim (2024): A systematic review and quality assessment of estimated daily intake of microplastics through food, Reviews on Environmental Health 40(2):371–392.
- Hayder, Laan and van Wezel (2026): Exposure to microplastics from food: comparative analysis of food types and quantification techniques, Journal of Hazardous Materials 501:140657.
- Qian et al. (2024): Rapid single-particle chemical imaging of nanoplastics by SRS microscopy, PNAS 121(3). Bottled-water estimate.
- FDA: Microplastics and nanoplastics in foods.
- Rauert et al. (2025): Assessing the efficacy of pyrolysis–GC/MS for nanoplastic and microplastic analysis in human blood, Environmental Science & Technology 59(4):1984–1994.
- Clough et al. (2026): Avoiding and reducing microplastic false positives from dry glove contact, Analytical Methods 18(14):2914–2926.
- Nihart et al. (2025): Bioaccumulation of microplastics in decedent human brains, Nature Medicine 31:1114–1119, and its author correction (March 31, 2025).
- CNN (republished by WRAL), February 3, 2025: Human brain samples contained a spoon’s worth of nanoplastics, study says. Interview with Matthew Campen.
- Monikh, Materić et al. (2025): Challenges in studying microplastics in human brain, Nature Medicine 31:4034–4035. Matters Arising, with the authors’ reply.
- Qian et al. (2026): Intrinsic physicochemical activity at microplastic–water interfaces, Nature 658:650–657, published October 14, 2026.
- Hussain et al. (2023): Release of microplastics and nanoplastics from plastic containers and reusable food pouches, Environmental Science & Technology 57(26):9782–9792.
- Li et al. (2020): Microplastic release from the degradation of polypropylene feeding bottles during infant formula preparation, Nature Food 1(11):746–754.
- Hernandez et al. (2019): Plastic teabags release billions of microparticles and nanoparticles into tea, Environmental Science & Technology 53(21):12300–12310.
Keep swapping
For everyday swaps, start with a stainless steel water bottle, then work through the kitchen: plastic wrap alternatives, kitchen utensils and plastic-free tea.